Software · Data Analysis
ClarityNeXt™ — Data Analysis Software
Take the next step with your data. A quantum leap forward in LIBS and LA-ICP-MS data processing, visualization, and reporting.
Overview
Taking the next step with your data
Applied Spectra’s new data analysis software, ClarityNeXt™, will advance your LIBS and LA-ICP-MS data processing and visualization to the next level. Through innovation in laser ablation-based sampling data analysis and reduction, you will benefit from efficient workflows, unparalleled emission line identification tools, a variety of qualitative and quantitative tools, automated processing, data visualization, chemical imaging, and the ability to fuse data from complementary analytical methods.
Rapid, accurate, and dynamic results are easy to achieve by utilizing these tools, with clear and concise report generation. ClarityNeXt™ is a quantum leap forward in LIBS and LA-ICP-MS data processing.
Why ClarityNeXt™
One workflow, from raw signal to report
Efficient pre-processing, powerful identification, advanced imaging, chemometrics, data fusion, and automation — all in a single environment.
Pre-analysis data visualization
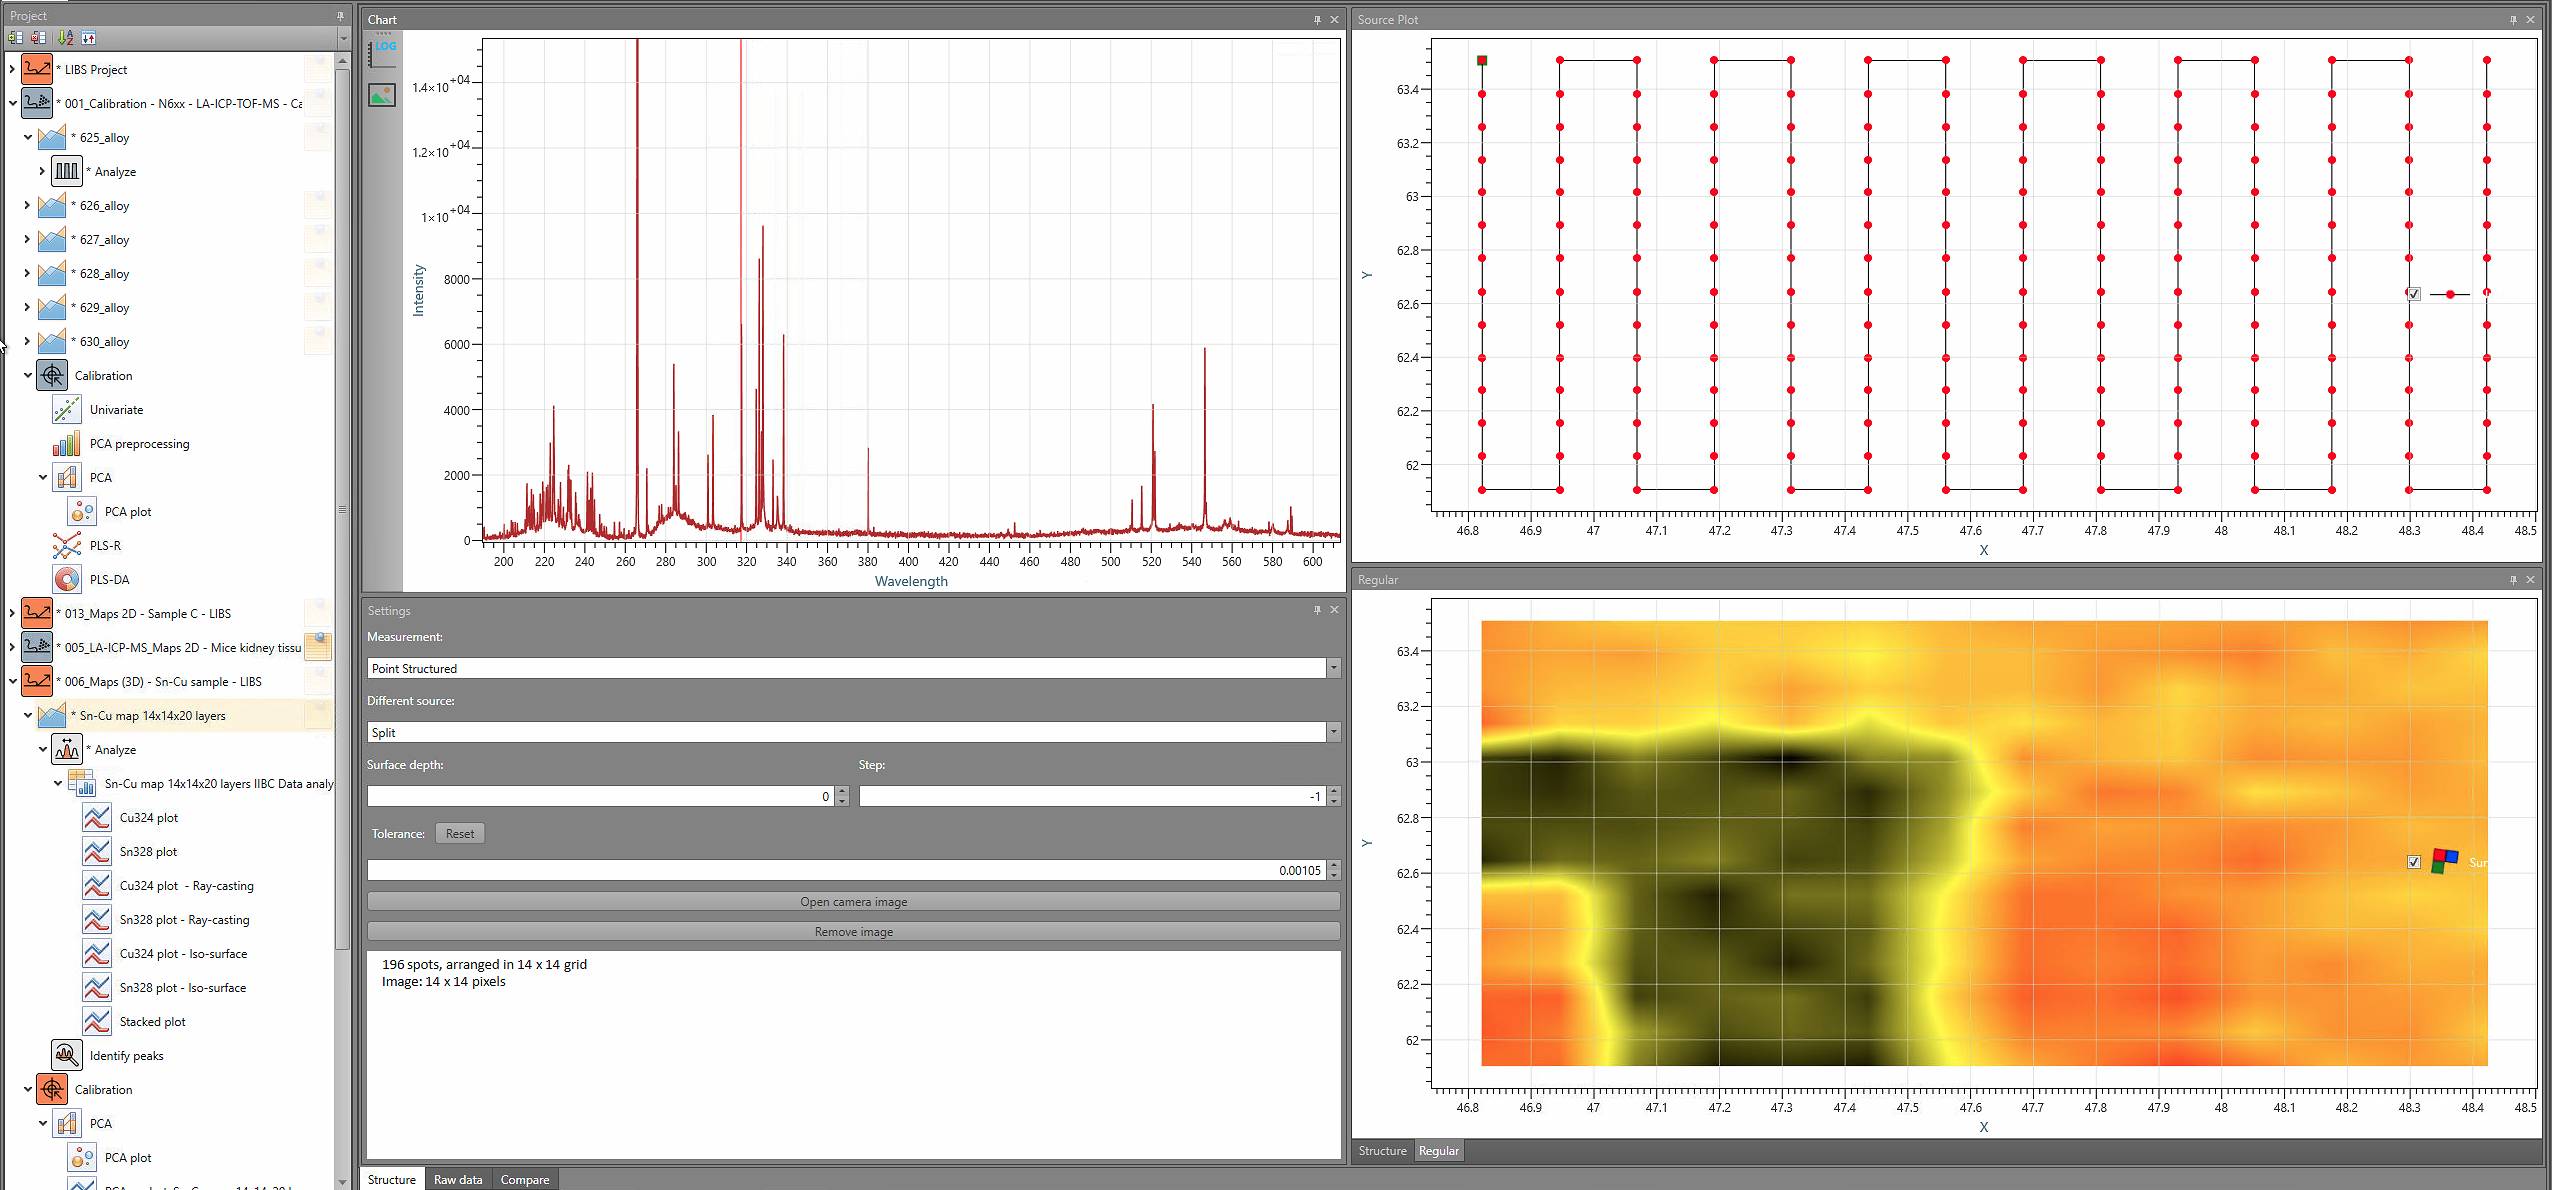
Review sampling patterns, qualify data, and preview 2D/3D elemental maps before you commit to full analysis.
Powerful processing tools
TruLIBS™ and other spectral libraries, expanded peak fitting, background subtraction, smoothing, and normalization.
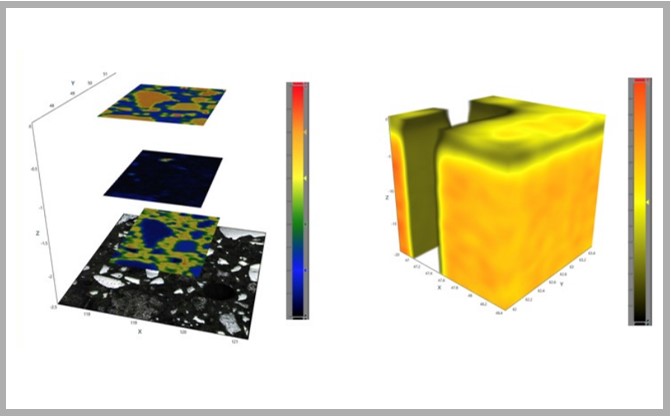
Advanced 2D/3D chemical imaging
Image overlays, Insync™ View, PCA maps, and stacked, ray-casting, and iso-surfacing map presentations.
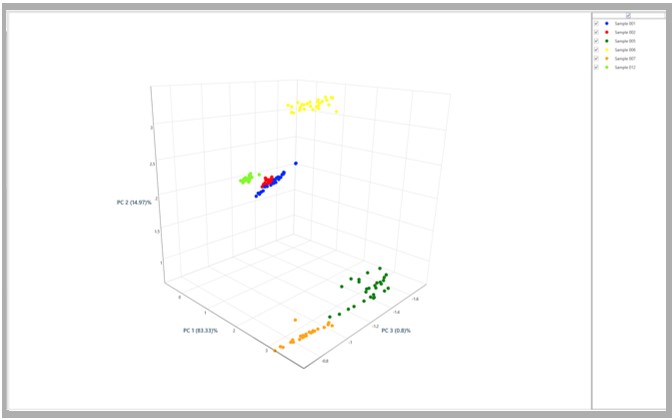
Built-in chemometric models
PCA, PLS-R, and PLS-DA for accurate quantification and classification, built directly into the workflow.
Data Fusion for Tandem LA-LIBS
Fuse complementary LIBS and LA-ICP-MS data for true Tandem LA-LIBS analysis of a single sample.
Analysis automation
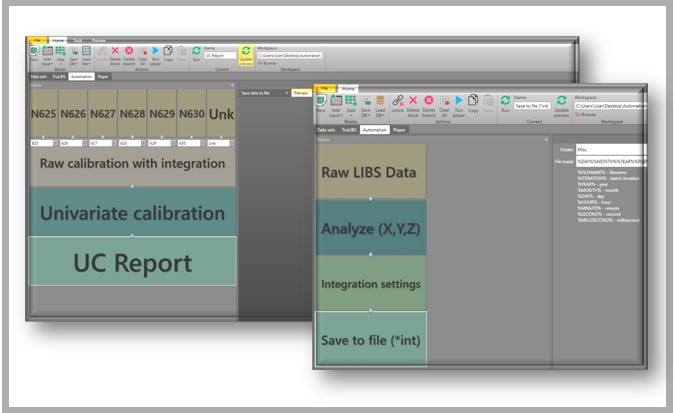
Automation Wizard and Player modules automate analysis steps for high-volume and routine measurements.
Pre-analysis data visualization
Qualify your data before you analyze it
- Review of laser ablation sampling pattern and measurement conditions. Confirm the data collection mode and number of points.
- Quick scan of all LIBS and LA-ICP-MS data; qualitative survey of elements/isotopes.
- Preview elemental maps (2D/3D).
- Easy comparison of LIBS and LA-ICP-MS data collected from different sample locations and under different measurement conditions. Qualify data for analysis.
Powerful processing tools
Rapid, accurate LIBS and LA-ICP-MS processing
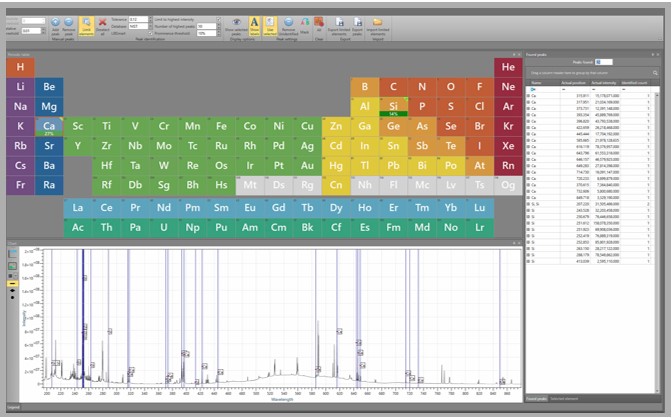
- Applied Spectra proprietary TruLIBS™ and other spectral emission libraries to rapidly identify elements.
- Expanded algorithms for peak fitting and background subtraction.
- Smart signal smoothing, spike removal, and normalization algorithms for time-resolved LA-ICP-MS data.
- Efficient pre-processing of LIBS and LA-ICP-MS data.
Advanced 2D/3D chemical imaging
The best insight and presentation
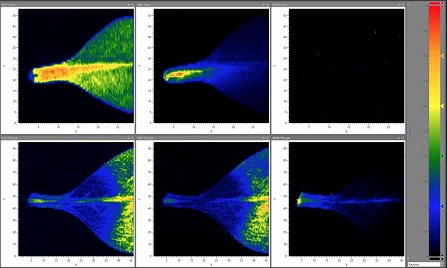
- Image overlays — multiple elements over sample images.
- Insync™ View.
- PCA maps.
- Stacked, ray-casting, and iso-surfacing maps.
Built-in chemometric models
Accurate quantification and classification
- PCA — Principal Component Analysis.
- PLS-R — Partial Least Squares Regression.
- PLS-DA — Partial Least Squares Discriminant Analysis.
Data fusion & automation
Tandem LA-LIBS analysis and automated workflows
- Data Fusion for true Tandem LA-LIBS analysis, combining complementary analytical methods on a single sample.
- Automation Wizard and Player module to automate analysis steps for high-volume and routine measurements.